
The Data Week Hits the Market, and the Market is in a Strong Wait-and-See Mood, Waiting for the Fed’s Interest Rate Decision GDP to be Released
- 2022-07-26
Fundamentals:
The U.S. CPI reached a new high in June, and the market once expected the Fed to raise interest rates by as much as 100 basis points in July. However, after a number of Fed officials’ speeches reinforced their unwillingness to raise interest rates by 100 basis points, the market’s expectations for a 100-basis point rate hike by the Fed in July fell quickly. This week, heavy economic data is released, including the second quarter GDP of US and the PCE price index in June. The recently released U.S. economic data showed mixed performances, highlighting the slowdown in the U.S. economic growth, and raising concerns about the U.S. economy entering a recession. However, the labor market remains resilient and lacks sufficient data to prove it, and the U.S. economy entered a recession. Officials said the pace of U.S. economic growth would be slowed to some extent as the Federal Reserve aggressively tightens monetary policy. Federal Reserve officials and U.S. Treasury officials expressed confidence in a soft landing of the U.S. economy without damaging the economy.
Technical side:
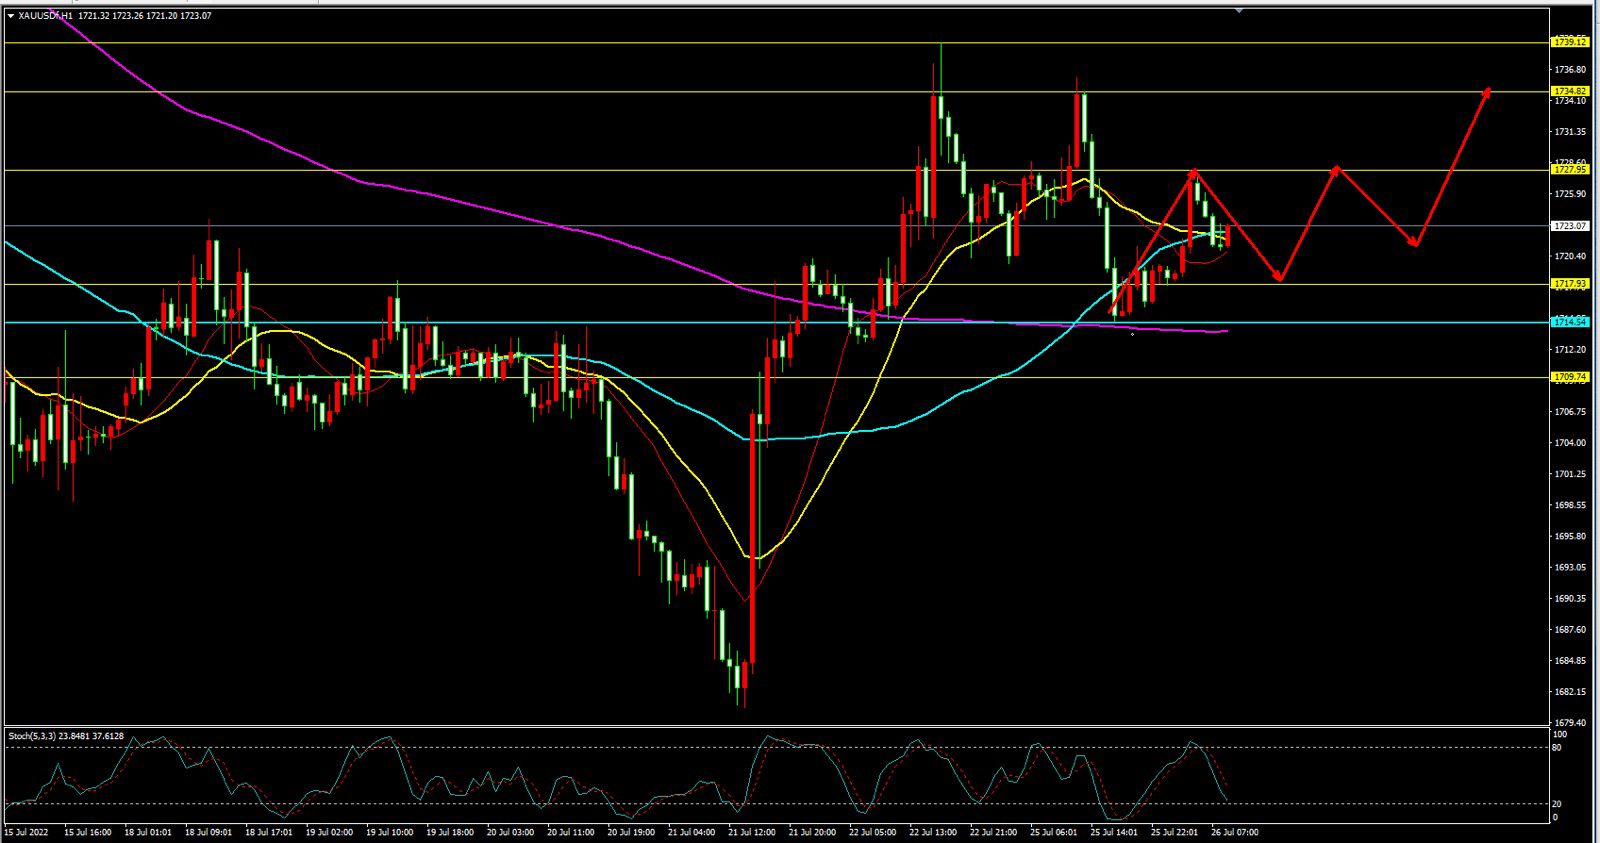
The downward momentum of gold in the monthly chart has not yet finished, and there is still continued downward momentum. The weekly decline structure has also remained intact, but the short-term signal of the weekly cycle has stopped falling, and there is a demand for rebound and correction in the short-term. The daily chart has not yet trended down, but the short-term stop-fall signal has appeared. The daily cycle recorded two consecutive positives in the past three trading days. However, the price of gold rose and fell yesterday, and the upward momentum has been reduced. Due to the heavy economic data this week and the event was released, and the current market sentiment is relatively strong, and the gold price in daily chart is expected to remain within the range for consolidation and shocks. The overall trend of the gold price in the four-hour chart is a more volatile pattern, and the overall trend of the gold price in the one-hour chart is a range-bound pattern. During the day, pay attention to the pressure above 1728/1736/1740; support position: 1718/1714/1709/1705. Intraday short-term trading is generally volatile and consolidating. The weekly chart focuses on the 1718-1728 range, and the four-hour chart focuses on the 1714-1736 range. Intraday short-term trading can focus on the 1-hour chart and the four-hour chart, which can be carried out within the range. The operation of selling high and sucking low. In operation, the price will step back around 1718, defend 1713, and look at the target in the range of 1727-1735-1740-1745.
Analyst by: Mr. Duke Ruan, Independent Analyst